
Snobs, Cities and Sacrifice
I love Sydney. Even though I am Melbourne raised and eschewed Sydney as a good Melbourne boy should I fell in love in 1985 and moved there in 1986. I rented a 3 bedroom federation cottage in Birchgrove with harbour views from the kitchen sink, I caught ferries to work and play, it was 22 degrees in the middle of winter. I left Melbourne in snow and the train brought me up on a full moon with dazzling views of a frozen highlands. It was fun and I could afford it. Not anymore.
Sydney had the glitz and glamour, but now had high culture and a decent football team (AFL of course), great food, good nightlife, new horizons. Sydney felt right, but my Sydney didn’t really extend beyond Ashfield to the west, North Sydney to the north, the airport to the south and all the way east to the ocean. I am a bit of a snob when I define my Sydney. It’s viewed through a lens from a different time. When I lived there the bulk of the lower-priced rental was actually in the inner city. This has, of course, changed, and low and moderate income households don’t rent—or live—where they used to.
I left Sydney in 2002. We could never afford home purchase, my parents were ageing and we figured we’d seen Sydney at its best. Fifteen years in midlife was great but how would the rest pan out? Overall the move has been good, we’ve paid off a house we now own, have good friends, we now have grandchildren that add extra spice. Would that have been possible if we’d stayed in Sydney?
True the humidity of Brisbane and those extra few degrees sometimes get to me and the food and culture up here improves without reaching that international standard, so every time I fly in to that big bold beautiful city that Sydney is, my heart still skips a beat as I take in the glorious vistas and I wonder… Then I realise we were paying $250 per week for a two-bedroom shop top flat in the heart of Enmore. While not flash it was well located; while noisy it had 50 restaurants within 200 metres, public transport on tap and a gastro pub across the road. It had room for our cat and even a small plot of backyard and a part of a garage. What would it cost now?
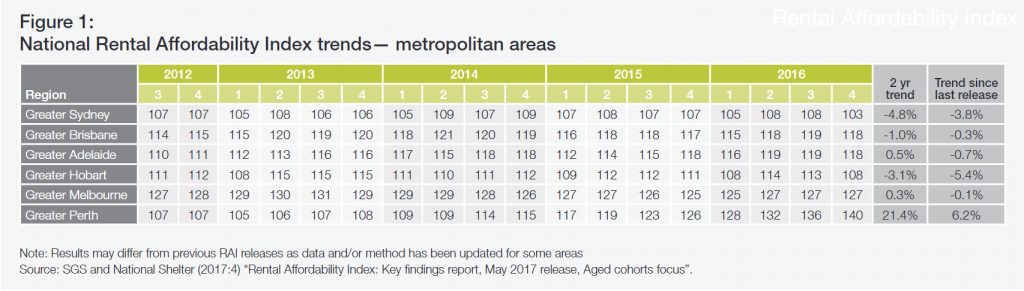
Well, based on our recent Rental Affordability Index (RAI), we would need a household income of $150,000 per year for the rent in that area to be moderately affordable, and that would mean the rent for our old flat would be about $800 per week. Sydney has become ridiculous.
This RAI showed what we all thought wasn’t possible, that rental affordability in Sydney has deteriorated further. All renters on average sit right on a threshold. The entire city, accounting for the incomes of all renters and the prices of current rents, is effectively unaffordable. You really need to be earning over $150,000 a year as a household to rent a two bedroom flat at anything like an affordable level. Even then you must pitch outside what I think of as Sydney. Not till you reach Canterbury, Parramatta, or Epping does it get affordable even with a household income of $150,000.
The average household income in Australia is around $85,000 per year. At that income only postage stamp areas in the Blue Mountains and beyond Richmond show affordable three bedroom rentals. Parts of Liverpool and on that radius are affordable for two bedroom properties, but we are into two hour commute country.
For pensioner couples trapped in the rental market virtually nothing in NSW is affordable to rent. They will be paying up to 65 per cent of their income to secure rental dwellings. Sydney is not alone in this regard, but fares the worst among our capital cities.
The RAI this year introduces some new features to our interactive map. The overall average data shows how close to the affordability threshold all dwellings in Sydney and many parts of NSW are, but the real story of rental affordability only comes out when one plays with income levels, household configurations and when you look over time.
The map is still being made freely available for public use and it’s a great tool that demonstrates rental affordability for any area we have data and that includes all of NSW.
Interestingly, Hobart is the second least affordable capital city. This is due to lower income levels relative to rents in Tasmania. After that Brisbane and Adelaide have moderate affordability, while Melbourne has the best rental affordability of all east coast capitals. Perth has been improving but just to reinforce the point, no capital city in Australia has any rental housing that is affordable for pensioners, low income working households and many, many others.
I have been using the RAI, especially the interactive map, to look at the Productivity Commission’s (PCs) recent Inquiry Into Human Services, specifically the social housing part of this report. The PC recommends (among other things) increasing CRA by 15 per cent for the most disadvantaged, supplemented by a similar payment from states. That amounts to about a $10 per week increase in CRA for a pensioner or pensioner couple.
A pensioner couple has an income of $45,000 per year, and this would lift that income by $520. Even if their income was added to by an additional $4,500 per year, bringing it to $50,000 (and more than doubling CRA), this would not lift them out of rental stress in Sydney.
Renters in the rest of NSW do not fare much better. For people with an income of $50,000 per annum most of the coastline in NSW remains unaffordable. Affordability wise, Coffs Harbour and the north coast look like Sydney. At $70,000 per year areas around Newcastle and Nowra and regional areas even on the coast become affordable but as we all know, peoples’ incomes in these areas are lower than those in Sydney.
This is a crucial point: affordability is relative to peoples’ capacity to pay. Some regional cities and towns (parts of the north coast are a case in point) have high rental costs in absolute terms. But even in areas where rents are lower, if the majority of the workforce is employed in, say, the service sector, even relatively modest rents will be unaffordable. The RAI is a new tool. At National Shelter we use it to raise the profile of rental housing affordability in the media. But it has also become a tool that people can utilize to look at affordability in their own area. Use the link, play with the variables and see what stories you can tell with it. I am going to use it to model the PC inquiry recommendations and take snapshot maps to show how little $10 a week will help in Australia’s rental market.
People make a lot of sacrifices to live in Sydney but the current rental market means more than sacrifices, it means genuine hardship, poverty and exclusion. People do without medicine, without food, without petrol, can’t register their car, pay insurance or fix broken appliances. The relative cost of rents, especially in Sydney, now generates real poverty and homelessness. This tool doesn’t fix that, but it does illustrate it. And getting that message through is vitally important.